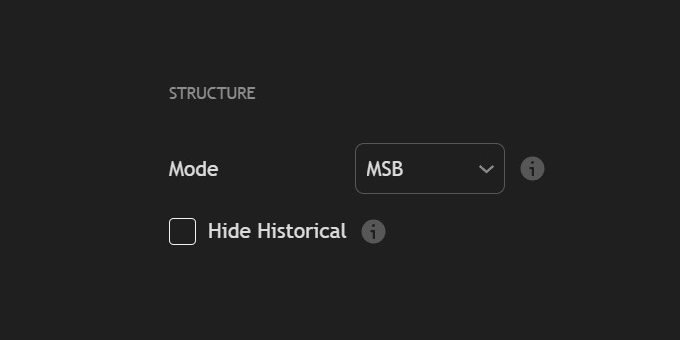
# Structure

Structure detection is the foundation of everything REx draws. This section controls which structural method REx uses — MSB or BOS — and how much historical data is shown on the chart.

***

<figure><img src="https://2404540482-files.gitbook.io/~/files/v0/b/gitbook-x-prod.appspot.com/o/spaces%2FuK39Nj2efLknCBW9clay%2Fuploads%2Fgit-blob-bf5a9dbc0d638b9a8395454adeda84ca3b499a0e%2Fstructure.png?alt=media" alt=""><figcaption></figcaption></figure>

***

## What is Market Structure?

Price doesn't move in straight lines. It sweeps highs, takes out lows, and creates ranges between those swings. Market structure is the map of those ranges.

* A **swing high** is a peak flanked by lower highs on both sides.
* A **swing low** is a trough flanked by higher lows on both sides.
* A **range** is the area between a confirmed swing high and swing low after a break.

When price breaks a swing, it marks a shift in momentum. That break — and the range it creates — is where REx draws your Order Blocks, Breaker Blocks, and key levels.

***

<table data-header-hidden><thead><tr><th width="40"></th><th></th></tr></thead><tbody><tr><td><mark style="color:green;"><strong>1.</strong></mark></td><td><kbd><mark style="color:purple;"><strong>Mode</strong></mark></kbd> defines how market structure is detected and displayed. Both engines run simultaneously — this setting controls which one is shown on the chart.</td></tr><tr><td></td><td>→ <a href="structure-str/msb"><strong>MSB</strong></a> — "Catch the turn early."</td></tr><tr><td></td><td>→ <a href="structure-str/bos"><strong>BOS</strong></a> — "Follow the trend, skip the noise."</td></tr><tr><td></td><td>The selected mode also determines where Order Blocks are placed — each mode uses a different structural reference point to define the zone boundary.</td></tr></tbody></table>

***

<table data-header-hidden><thead><tr><th width="40"></th><th></th></tr></thead><tbody><tr><td><mark style="color:green;"><strong>2.</strong></mark></td><td><kbd><mark style="color:purple;"><strong>Hide Historical</strong></mark></kbd> removes past structure data from the chart, keeping only the most recent and relevant information visible for a cleaner view.</td></tr></tbody></table>

***
