Appearance
High Timeframe
REx analyzes market structure on a higher timeframe than your chart — this is what gives the indicator its multi-timeframe edge. This section controls which HTF REx uses and what supporting information is displayed on the chart.
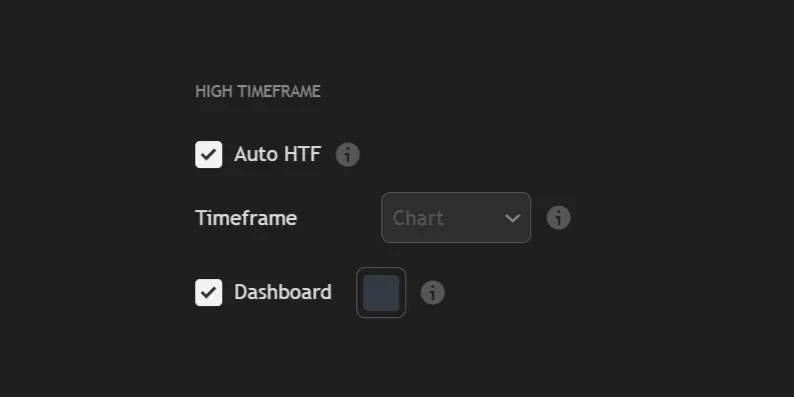
| 1. | Auto HTF uses predefined timeframe pairs to make switching timeframes fast and easy. It automatically adjusts when you change the chart timeframe, so no manual setup is needed. |
| 2. | Timeframe allows you to manually create your own timeframe pairs by selecting the higher timeframe you want to view. Chart mode disables multi-timeframe behavior and makes the indicator run entirely on your current chart timeframe. To use either of these options, Auto HTF must be turned off. |
WARNING
If you want to use a custom timeframe (for example, 36 minutes), you need to add it manually in TradingView under Add Custom Interval. Once added, the indicator will automatically detect it and make it available as a selectable option.
.webp)
| 3. | Dashboard is an optional panel that appears in the bottom-right corner of the chart. It shows the current mode, the active timeframe pair, the HTF/Internal/LTF trend directions, and the high and low of the most recent HTF range. |
Auto HTF Mapping
When Auto HTF is enabled, REx automatically selects the higher timeframe based on your chart.
| Chart Timeframe | HTF |
|---|---|
| Daily or 12H | Monthly |
| 4H | Weekly |
| 1H | 12H |
| 15m | 4H |
| 5m | 1H |
| 1m | 15m |